
KanuniLabs DataGrid & PivotGrid

- No match
Machine translation — the English original is authoritative.
The Story
Every data grid demo looks fast until you give it real data. This one started from the other end: a million rows in the browser, with sorting, filtering, grouping and aggregation running in a Web Worker so the page keeps responding while it works.
The part that took longest was not the grid. It was the install. A worker is a separate script and its URL depends on whichever bundler you use, so most libraries hand you a README section per bundler. We compile the worker into the package and start it from a Blob URL instead, so npm install is the whole setup — in Vite, Next.js, webpack, or a plain script tag. It cost 30.1 KB (about 17%) on the core package. Measured, not estimated.
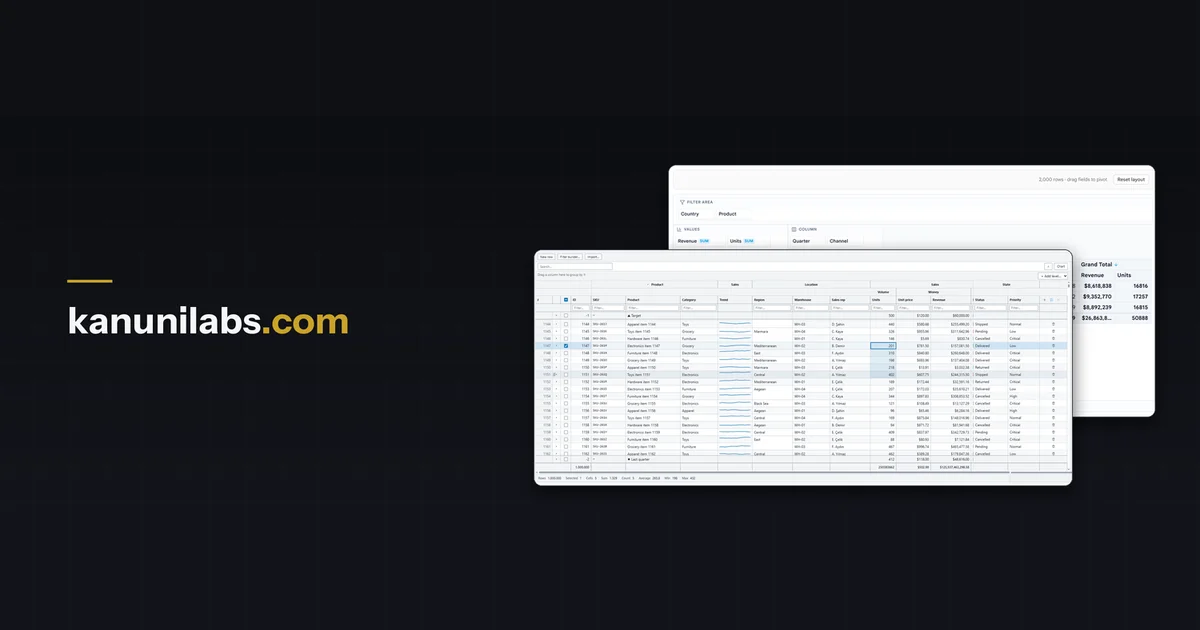
KanuniLabs is two components over that engine. DataGrid does virtualized rows and columns, sorting, filtering, grouping and export. PivotGrid does drag-and-drop pivoting with a field panel your users drive themselves. Both ship for React and for plain JavaScript with no framework at all, both are typed, and both carry 12 locales with right-to-left support and six themes in light and dark.
98 of the 136 documented features need no licence key: the free tier is a real tier, with no watermark and no expiry. The paid tier adds inline editing, master-detail, charts, calculated fields, drill-down and styled Excel and PDF export, and one key covers both components.
The playground on the site loads the million rows and lets you sort and filter them yourself, which is a better answer than any number in this box.
AI Overview
AI-generatedPerformant data visualization in the browser has long required choosing between rich functionality and the responsiveness users expect. KanuniLabs addresses this by delivering a data grid and pivot table component that processes a million rows without blocking the user interface, handling sorting, filtering, and aggregation through a Web Worker engine that keeps the main thread responsive.
The product targets React teams and vanilla JavaScript developers who need to display, analyze, and export large datasets. It shines where off-the-shelf grids typically falter: applications that must handle real-world data volumes without sacrificing interactivity. The founder's engineering philosophy surfaces clearly in the execution—the most difficult problem solved was not the performance itself but making that performance accessible through a straightforward installation process. Web Workers typically require framework-specific configuration across bundler environments. KanuniLabs compiles the worker directly into the package and launches it from a Blob URL, meaning developers install the library and immediately have a functioning grid without additional setup in Vite, Next.js, webpack, or plain HTML.
DataGrid provides virtualized rendering of rows and columns with built-in sorting, filtering, grouping, and export capabilities. PivotGrid layers drag-and-drop field manipulation and aggregation on the same engine, making it suitable for users who need to explore data interactively. Both components support 12 locales including Arabic with full right-to-left rendering and six themes across light and dark variants. Calculated fields incorporate a formula editor designed around content security policies, avoiding dangerous eval patterns while still offering live preview and editing.
The licensing model clarifies a straightforward split: 98 of 136 documented features work without a license key, covering the functionality most teams rely on—virtualization, filtering, grouping, and basic export. No watermarks, trial timers, or sign-ups gate access to this tier, even for commercial use. The paid edition adds inline editing, master-detail views, styled Excel and PDF export, calculated fields with advanced functionality, and drill-down navigation. A single key covers both components. The approach inverts the typical freemium structure: the free tier delivers a complete product rather than a time-limited taste, making it genuinely useful for smaller teams and side projects while clearly signaling where businesses requiring full feature coverage should invest.
Verification is built into the product philosophy. The site runs a live playground with a million-row dataset under user control, making performance claims reproducible rather than theoretical. This transparency, combined with the straightforward business model and the pragmatic focus on solving real installation headaches, distinguishes the offering.
Founder Diary
DevlogThe maker hasn't posted a diary entry yet.
Key Features
Million-Row Performance
Processes a million rows without blocking the user interface using a Web Worker engine.
Zero-Config Web Workers
Compiles workers directly into the package via Blob URL, eliminating bundler configuration.
Virtualized Rendering
Includes sorting, filtering, grouping, and aggregation with virtualized rows and columns.
PivotGrid Drag-Drop
Offers drag-and-drop field manipulation and aggregation for interactive data exploration.
Multi-Locale Support
Supports 12 locales including Arabic with full right-to-left rendering and six themes.
Use Cases
-
1
React Teams
Display and analyze large datasets without sacrificing interactivity or user responsiveness.
-
2
Vanilla JavaScript Developers
Implement data visualization across bundler environments without complex setup.
-
3
Million-Row Applications
Handle real-world data volumes where typical off-the-shelf grids typically falter.
-
4
Data Exploration Workflows
Enable users to interactively explore data through pivot tables and calculated fields.
FAQ
Can I use KanuniLabs DataGrid for free? ▾
Does this work with Next.js and Webpack? ▾
What do I get with a paid license? ▾
How do you prove it handles a million rows? ▾
Pricing
Free tier includes 98 of 136 features with no watermarks; paid license required for inline editing and advanced export.
Tech Stack & Tags
Discussion (1)

We are here to become an essential part of your web projects. Welcome.
Join the conversation — sign up to comment.
Sign up freeCommunity Support
Boost this project on Sell With boost
Meet the Founder
More in Website builders

Bg Remover
Powerful AI Image Tools for Easy Editing Create...
WordPress Speed Optimization Service
WordPress Speed Optimization Service helps busin...
Synor Web development and digital marketing agency
Synor Is one of the best web development and dig...

BuiltToWinWeb
I built BuiltToWinWeb because businesses were st...

Screenshot to Code
I created Screenshot to Code to solve a problem...

MaaJanki Web Tech
We built MaaJanki Web Tech to solve the biggest...