
WebSignalytics
- No match
Machine translation — the English original is authoritative.
The Story
I started in graphic design, which led to marketing, then AI, then building things. I could never figure out why data reporting stops at the raw data — why not take the small step further and put the data in terms the user can understand, rather than forcing them to learn new nomenclature. You're either user-centric or you're not. So in that spirit, I built WebSignalytics to bridge the gap between web analytics and the rest of us.
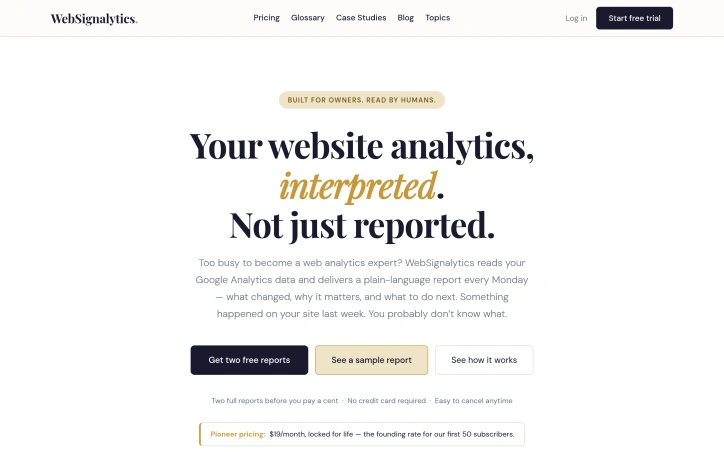
It connects to Google Analytics and sends a plain-English report every Monday: what changed on your site last week, what it means, and what's worth doing about it. No dashboard to learn, no metrics to look up. It's for people who run a business and have a website they care about, but who were never going to become analysts — independent consultants, small firms, solo practitioners.
I built it solo, using AI-assisted development rather than a software engineering background.
AI Overview
AI-generatedAnalytics platforms record everything but rarely explain anything. That's the gap WebSignalytics addresses. Rather than leaving small business owners, consultants, and solo practitioners drowning in metrics and charts, the service connects to Google Analytics and delivers a plain-language summary every Monday—complete with what actually changed on their site, why it matters, and which changes warrant action.
The core insight is straightforward: most website owners aren't analytics specialists. They connected Google Analytics because it seemed important, which it is. But GA4 faithfully records data without interpretation. A traffic drop of 40 percent to a top-performing page looks like one data point in a dashboard filled with hundreds. A broken contact form doesn't announce itself; it just quietly stops converting. A surge from an unexpected source stays invisible until the moment passes. WebSignalytics bridges that gap by doing the interpretive work upfront.
The weekly report format itself is notable. Rather than inviting users into another dashboard they'll rarely visit, the service brings insight directly—a narrative account of what shifted in the past week, flagged issues like tracking gaps, and concrete next steps. This is built for humans who run businesses, not for people who've chosen analytics as a profession.
The founder, who trained in graphic design and marketing before moving into AI-assisted development, brings a user-centric philosophy to the work. That sensibility shows: the product skips the industry jargon and complex menus in favor of clarity. There's no nomenclature to learn, no dashboard to master.
The pricing structure reflects early-stage ambitions. At 19 dollars per month, locked in permanently for the first 50 subscribers, it's positioned as founder pricing rather than a standard market rate. New users can request two free reports before committing, with no credit card required. The simplicity extends to cancellation—the copy emphasizes how easy it is to walk away.
The most immediate use case is for owners of small to medium websites who've invested in Google Analytics but lack the expertise or bandwidth to monitor it consistently. The weekly cadence assumes they're too busy to check daily but not so disconnected that they'd miss weekly intelligence. For that specific audience, the value proposition is direct: keep your site healthy without becoming an analyst.
Founder Diary
DevlogThe maker hasn't posted a diary entry yet.
Discussion
No comments yet — be the first!
Join the conversation — sign up to comment.
Sign up freeCommunity Support
Boost this project on Sell With boost
Meet the Founder

More in Website analytics

Glazed AI
Glazed creates and ships tracking events from Fi...

Website Auditor
I built Website Auditor to help small businesses...

GA Lite
Understanding how your websites are doing should...

Leakly
We built Leakly because we saw businesses throwi...

Skippership
Get full session replays, interactive heatmaps,...

QueryTrace
I built QueryTrace because every company cares a...