
MakeGraph
The Story
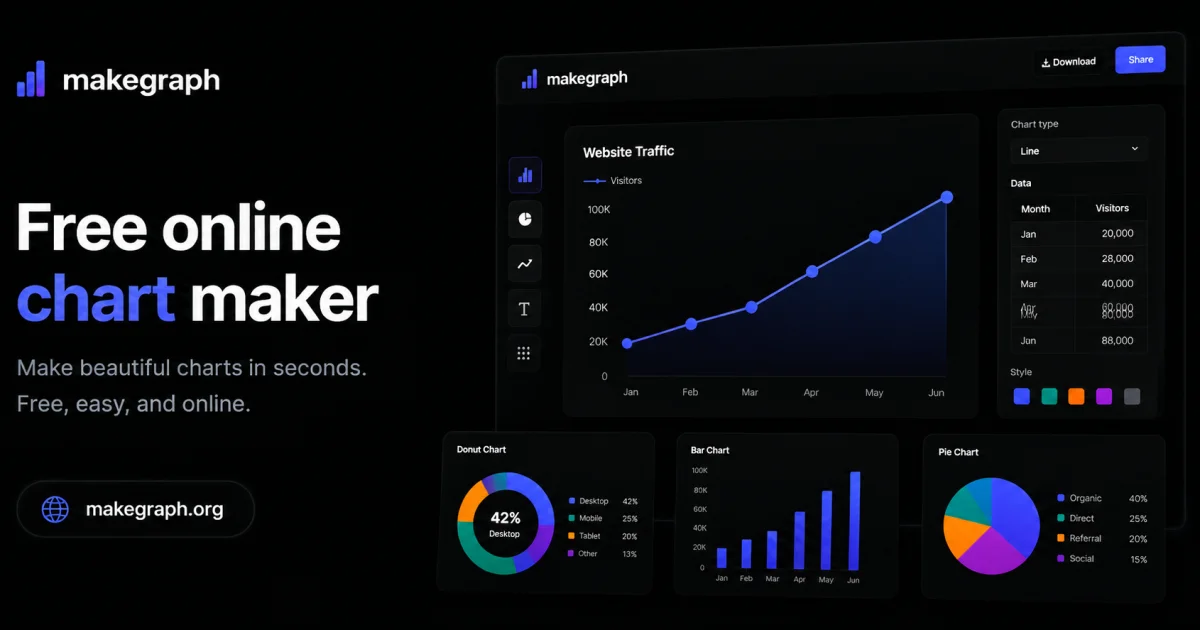
I created MakeGraph to help users turn their data into clear charts quickly. It solves the problem of tedious data visualization by providing a simple online chart maker. Users can upload their data and export charts as PNG or SVG instantly.
AI Overview
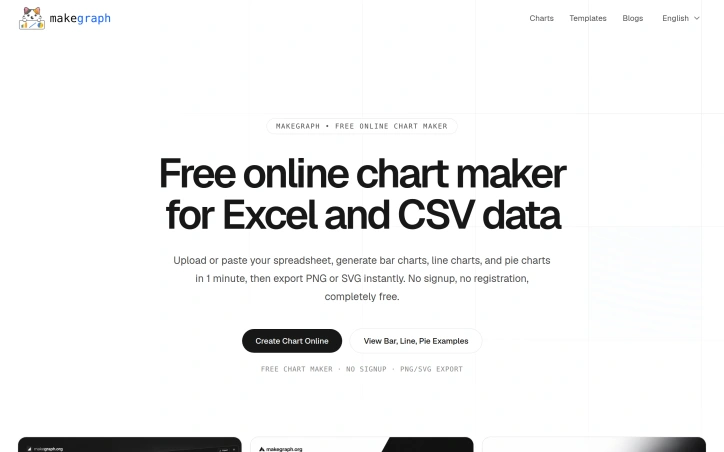
AI-generatedData visualization is a crucial step in understanding and presenting complex information, but creating clear and compelling charts can be a tedious task, especially for those without extensive design or technical expertise. MakeGraph addresses this issue by providing a straightforward online chart maker that allows users to quickly transform their data into visually appealing charts. The tool is designed for individuals who need to generate charts for reports, presentations, and dashboards, and is particularly useful for those working with Excel or CSV data.
What stands out about MakeGraph is its simplicity and versatility. The platform offers a range of chart types, including line charts, scatter charts, radar charts, and various bar chart configurations, such as stacked and waterfall charts. Users can upload their data or paste it directly into the tool, customize labels and colors, and preview their charts instantly. The ability to export charts as PNG or SVG files adds to the tool's convenience, making it easy to integrate the visualizations into various applications.
The key features of MakeGraph include its ease of use, instant preview capabilities, and support for multiple chart types. The fact that it is completely free, with no signup or registration required, makes it an attractive option for users who need to create charts on the fly. The tool's flexibility in handling different data formats and its customization options further enhance its utility. Overall, MakeGraph is a valuable resource for anyone looking to simplify their data visualization process and create high-quality charts without fuss.
Key Features
Chart Types
Supports multiple chart types including line, scatter, and bar charts
Data Handling
Handles different data formats such as Excel and CSV
Customization Options
Allows customization of labels and colors
Export Options
Enables export of charts as PNG or SVG files
Instant Preview
Offers instant preview of charts
Use Cases
-
1
Report creators
Need to generate charts for reports
-
2
Presentation makers
Require charts for presentations
-
3
Dashboard builders
Need to create charts for dashboards
-
4
Data analysts
Working with Excel or CSV data can benefit from the tool
FAQ
What data formats does MakeGraph support? ▾
Can I customize the charts created with MakeGraph? ▾
What file formats can I export charts in? ▾
Pricing
No signup or registration required
Tech Stack & Tags
Discussion
No comments yet — be the first!
Join the conversation — sign up to comment.
Sign up freeCommunity Support
Boost this project on Sell With boost