
DebugClip
- No match
Machine translation — the English original is authoritative.
The Story
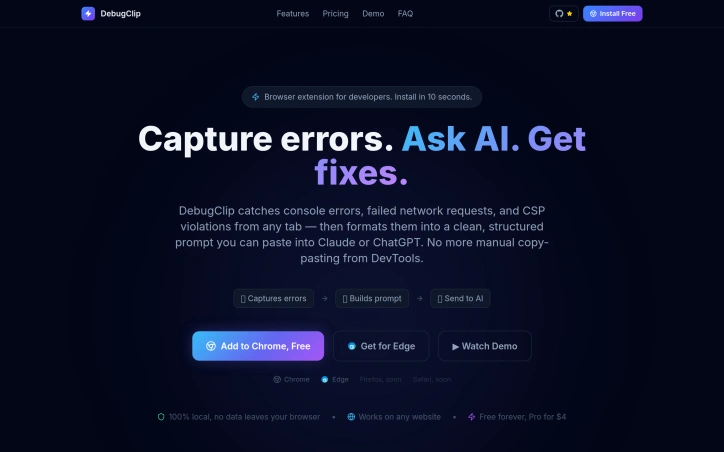
I built DebugClip because developers waste 5-10 minutes per bug context switching between DevTools and ChatGPT. The extension captures browser errors, network failures, and security issues, auto-formatting them into perfect prompts for AI. You get actionable fixes in seconds, not painful copy-paste cycles.
AI Overview
AI-generatedDebugging consumes far more time than it should, and developers have gotten used to it. The typical workflow involves spotting an error in the browser console, manually opening Chrome DevTools to gather context, copying fragments into ChatGPT or Claude, re-explaining the problem when the AI's first response falls flat, then repeating the cycle dozens of times per day. Each context switch costs focus and momentum.
DebugClip addresses this friction by automating the bridge between where errors happen and where developers get help. The Chrome extension captures console errors, network failures, and security violations as they occur, then compiles them into a structured prompt ready to send to Claude or ChatGPT with a single click. Rather than manual transcription, developers get stack traces, request headers, response bodies, and HTTP status codes included automatically.
What sets this approach apart is elimination of context switching. The extension runs silently in the background and notifies developers when issues occur, presenting everything alongside the problems themselves in a clean dashboard. The promised result is moving from discovery to actionable fix in under ten seconds, replacing workflows that consume five to ten minutes per error.
The feature set mirrors what DevTools already exposes but streamlines access and AI integration. It captures every console error and warning, unhandled promise rejections, failed API calls with network details, broken resource loads, and CORS or CSP violations. This breadth ensures developers rarely need to jump back into DevTools to gather missing context.
The business model is straightforward. The extension is free to use indefinitely on all websites, with a paid tier at four dollars monthly for presumably enhanced functionality. The developer emphasizes local processing, meaning captured errors remain on device and do not transmit to DebugClip servers.
For developers who spend significant time debugging or testing in the browser, the extension removes a well-documented source of wasted motion. The positioning is narrow and focused, targeting a single pain point without attempting to replace DevTools or become an all-in-one solution. Chrome and Edge support is available now, with Firefox and Safari compatibility planned. The free tier makes adoption frictionless.
Founder Diary
DevlogThe maker hasn't posted a diary entry yet.
Key Features
Error Capture
Automatically captures console errors, network failures, and security violations as they occur.
AI Integration
Compiles debugging data into a structured prompt for Claude or ChatGPT with one click.
Automatic Context
Includes stack traces, request headers, response bodies, and HTTP status codes automatically.
Background Notifications
Runs silently in the background and alerts developers when issues occur.
Debug Dashboard
Presents all captured errors and diagnostics in a clean, organized dashboard.
Network Monitoring
Captures failed API calls, broken resource loads, and CORS/CSP violations.
Use Cases
-
1
Browser Debugging
Reduces time spent gathering debugging information and re-explaining issues to AI assistants.
-
2
QA Testing
Eliminates manual transcription by automatically capturing test failures with full context.
-
3
Daily Development Workflow
Removes context switching friction between DevTools, console, and AI assistance.
FAQ
Does DebugClip send my data to their servers? ▾
What browsers does DebugClip support? ▾
How much does DebugClip cost? ▾
What types of errors can it capture? ▾
Pricing
Free tier available indefinitely on all websites; paid tier includes enhanced functionality.
Tech Stack & Tags
Discussion
No comments yet — be the first!
Join the conversation — sign up to comment.
Sign up freeCommunity Support
Boost this project on Sell With boost
Meet the Founder

More in Chrome Extensions

Page Walker
Read with Ease, Browse with Comfort. Page Wa...

SFM - Surface Filter Mode
Our Surface Filter Mode (SFM) plugin enhances we...

LexiLint
LexiLint started from a simple frustration: ever...

How Much Does It Cost? - Know what things really cost. in dollars and lattes
How Much Does It Cost? — The Chrome extension th...
Tabme
I'm Oleg, the creator of Tabme. A few years ago...

Sidenote
I kept catching AI summaries that were confident...