Catalyst Healthspan Audit
Personal trainers typically sell training sessions. This startup reversed the equation by building assessment first, mak...
Launchory
We built Launchory to solve the discoverability problem for startups. Our platform offers instant approval, permanent do...
Best Observability tools Startups & Tools
Metrics, logs, traces, incident response, and AI-driven automation for reliable systems.
Recently Listed
5 launches
Developers working with large local log files on macOS, Windows, or Linux can struggle with unwieldy text files and time-consuming manual investigation. LogoRRR addresses this friction by bringing visual analysis tools to desktop-based log exploration, eliminating the need to upload data to cloud services or maintain external accounts. The product's core value proposition centers on privacy and speed. Log files remain on the user's machine throughout the analysis process, with no uploads or server dependencies required. This approach matters for enterprises handling sensitive data, developers in restricted network environments, and anyone who simply wants to avoid the overhead of cloud-based log ingestion. The application works offline, making it practical for field investigations or work in disconnected settings. Visually distinguishing error clusters is what sets LogoRRR apart from basic text editors. The interface uses an interactive block view that color-codes log entries by severity or search terms, allowing investigators to spot patterns across millions of lines at a glance. This shifts the workflow from scrolling and searching toward pattern recognition. Complementary features include multi-file merging to correlate logs from different sources, time-based activity views, and filter-driven narrowing to isolate relevant events. Performance handling large files is central to the pitch. The application claims to open gigabyte-scale logs while maintaining responsiveness and modest memory consumption, a constraint that matters when analysts are also running other tools on the same machine. The implementation prioritizes native performance over web-based convenience. The quick-start workflow is straightforward: drop a log file, directory, or compressed bundle onto the application window, then navigate using filters and searches. LogoRRR targets developers and support engineers who perform hands-on log analysis rather than relying on centralized observability platforms. It competes not against cloud logging services but against manual investigation of local files or lightweight text tools. For teams that need to trace incidents in local production logs, legacy application output, or offline environments, the local-first model eliminates friction without requiring infrastructure changes.

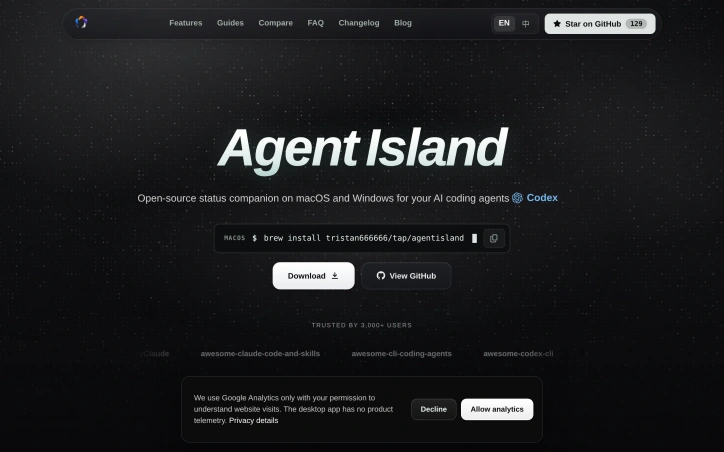
For developers managing multiple AI coding agents simultaneously, tracking active sessions and monitoring usage across Claude Code, Codex, Antigravity, Grok, and Cursor presents a constant friction. Agent Island addresses this directly—a local-first status companion that lives in your menu bar and keeps session state, quotas, and costs visible without requiring cloud infrastructure or user telemetry. What distinguishes Agent Island is its architectural stance: the application runs entirely on your machine, reads transcript files your tools already generate, and maintains zero dependency on external servers or Agent Island accounts. This design choice matters. It means your coding patterns stay private, API integrations leverage tokens you already control, and the tool's benefit doesn't hinge on a company's continued operation. The code is open source under the MIT license with every line public on GitHub. The feature set addresses genuine workflow pain points. Real-time session monitoring surfaces when an agent is working, waiting, or stalled—the distinction that determines whether you should check on progress. Usage tracking combines token counts with estimated API costs and displays weekly summaries breaking down model preferences and ranking your consumption against other users. The application integrates deeply with the operating system: on macOS it occupies the notch, on Windows it hooks into the taskbar, and both implementations alert you when your next turn arrives rather than requiring you to poll manually. Installation is straightforward—one Homebrew command on macOS or a single executable download on Windows. The macOS version ships with ad-hoc signing rather than a paid developer certificate, which triggers a one-time security prompt on first launch; subsequent updates are verified using EdDSA signatures before installation. The product has accumulated significant adoption across numerous community directories and "awesome" lists, with over three thousand reported active users. No pricing exists by design—this is open source software with no commercial licensing, subscriptions, or freemium upsells. Agent Island fills a specific but real niche: developers who work across multiple AI coding agents and need centralized visibility into session state and spending patterns. The commitment to local processing, transparent code, and zero telemetry will resonate with users who prioritize privacy. For those already managing these tools, the menu bar integration makes monitoring frictionless enough to justify installation.

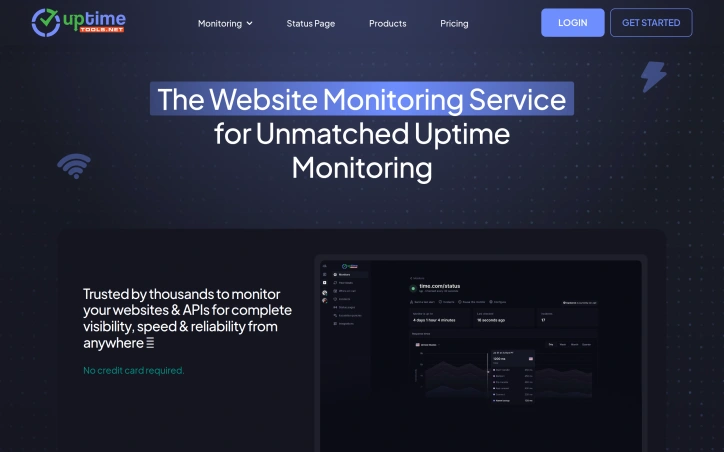
Organizations managing web infrastructure face a consistent blind spot: they discover outages through customer complaints rather than automated detection. A website might fail silently, an API might return errors intermittently, or performance might degrade without anyone noticing. UpTimeTools addresses this gap by providing continuous monitoring and alerting across websites, APIs, and servers, with instant notification when something breaks. The platform targets developers, IT operations teams, and digital agencies that need proactive visibility into service reliability. These users benefit from catching issues before customers encounter them, rather than learning about problems through support channels. Several product decisions distinguish UpTimeTools from conventional monitoring solutions. The platform combines basic uptime checking with synthetic testing—verifying critical user flows by running real browser tests that go beyond simple connectivity checks. API monitoring operates as a parallel capability, allowing independent tracking of back-end availability. Real user monitoring captures how services actually perform for visitors in production, revealing issues that lab conditions would miss. The alerting design confronts a real operational problem: false positives erode trust in monitoring systems. Group checks combine results from multiple sources to confirm genuine incidents rather than triggering on transient hiccups. Notifications fan out through SMS, email, phone calls, Slack, and other integrated channels, reducing the risk that critical alerts get missed. The feature set reflects operational maturity. Private location monitoring enables tracking of infrastructure behind firewalls. Custom status pages communicate incident status to stakeholders. Detailed reporting identifies performance trends and optimization opportunities. The platform operates 80 global monitoring points, enabling geo-distributed testing. The pricing structure emphasizes accessibility. UpTimeTools operates on recurring subscription plans with no credit card required to begin using the service. The company bundles synthetic monitoring, API monitoring, and 20+ integrations into all plans rather than reserving them for premium tiers, positioning comprehensive monitoring as baseline functionality. Premium plans include unlimited user accounts, enabling growing teams to scale without per-user surcharges. Single sign-on works across all subscription levels. The platform delivers enterprise-class capabilities—synthetic testing, real user monitoring, alert routing, incident status pages—with emphasis on simplicity. For teams that can't justify dedicated monitoring engineers or afford enterprise monitoring platforms, UpTimeTools provides a practical alternative that starts simple and grows with operational complexity.

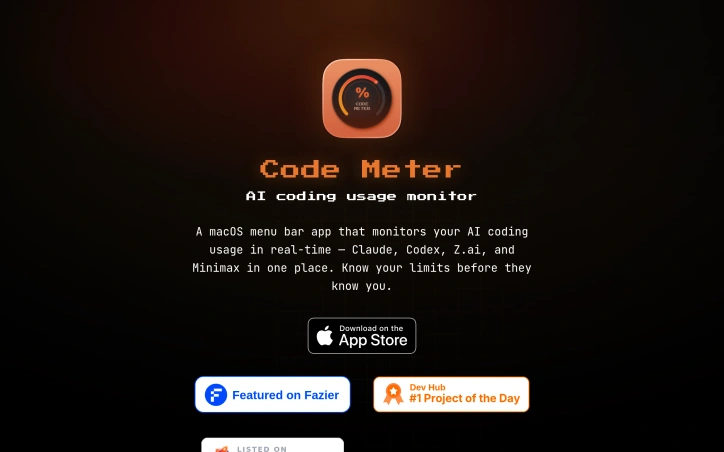
Managing API costs for AI coding tools is a practical concern developers face regularly. When integrating Claude, Codex, Z.ai, or Minimax into your workflow, exceeding your usage limit or hitting rate ceilings can disrupt development or trigger unexpected charges. Code Meter addresses this problem by delivering real-time usage monitoring in the macOS menu bar, giving developers visibility into consumption before issues occur. The product's core value is immediate and simple: install it, authenticate with your chosen provider, and see usage metrics without checking dashboards or guessing remaining capacity. Setup completes in seconds, and the app supports four major AI coding providers, making it relevant across different tool preferences. What distinguishes Code Meter is its privacy architecture. Rather than funneling credentials through intermediary services, the application reads credentials locally from macOS Keychain and communicates directly with each provider's API—Anthropic, OpenAI, Z.ai, or Minimax. Credentials never leave your device. Usage history stores locally via SwiftData, and widget data remains isolated in App Group containers. This design choice appeals to developers concerned about credential exposure, especially in regulated industries or security-sensitive environments. The privacy commitment extends to analytics. Code Meter uses PostHog for anonymous product telemetry—recording only app version, OS version, and feature interactions—hosted on EU Cloud infrastructure with IP capture and device fingerprinting disabled. It represents a transparent approach to usage analytics; the company documents what it collects and explicitly discloses why. The feature set covers essentials: the menu bar widget shows usage at a glance, additional widgets provide supplementary views, and historical charts enable tracking over time. Alerts flag overages before they compound. The product is a free download from the Mac App Store, requiring macOS 26 or later. RevenueCat infrastructure suggests potential premium features, though none are documented currently. Code Meter solves a concrete problem for developers managing multiple AI APIs with a privacy-first architecture that rejects the surveillance model prevalent in developer tools. Its strength lies in restrained functionality delivered without data extraction. Developers get visibility where it matters—their own usage—without surrendering credentials or behavioral data to another platform.

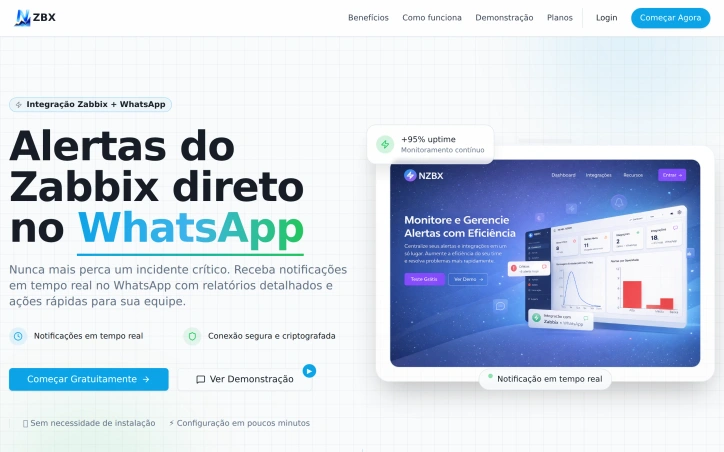
Infrastructure teams managing Zabbix monitoring systems face a persistent challenge: critical alerts get lost in noise or delayed in reaching the right people. NZBX addresses this by channeling Zabbix notifications through WhatsApp, transforming a ubiquitous messaging platform into a real-time incident command center. The product targets DevOps and infrastructure teams already running Zabbix but wanting faster, more direct alert delivery. Instead of checking dashboards or waiting for email, incidents appear instantly in WhatsApp where team members already spend their working day. What distinguishes NZBX is its simplicity and speed. The service requires no server installation—it connects to existing Zabbix instances through API authentication and delivers alerts in under three seconds. Setup takes five minutes, placing it at the low-friction end of the integration spectrum. End-to-end encryption and stated LGPD compliance address data security concerns when routing infrastructure alerts through third-party services. Beyond basic alerting, NZBX includes a dashboard for tracking metrics, interactive graphs, detailed reports, and data export. An AI-powered grouping system suppresses redundant alerts, with the platform claiming an 80 percent noise reduction. The service supports multiple Zabbix instances, granular user permissions, and access logging, indicating it's built for teams rather than solo operators. The stated 99.9 percent availability target and 24/7 support position it as infrastructure-grade tooling. The integration strategy extends beyond Zabbix. The platform mentions compatibility with webhooks, GPT integration, and other monitoring tools, suggesting a broader alert aggregation roadmap. Up to 50 simultaneous users can access the system, and documentation appears comprehensive. Pricing remains opaque. The site emphasizes free trials and no installation requirements but provides no transparent pricing details. For teams drowning in Zabbix alert fatigue, NZBX offers a pragmatic shortcut to faster incident response. The product's actual value depends on execution—whether the sub-three-second delivery consistently holds and whether AI-powered grouping reduces signal loss rather than suppressing critical alerts. These are testable claims worth validating before committing a team to the platform.