Catalyst Healthspan Audit
Personal trainers typically sell training sessions. This startup reversed the equation by building assessment first, mak...
Launchory
We built Launchory to solve the discoverability problem for startups. Our platform offers instant approval, permanent do...
Best Data analysis tools Startups & Tools
Recently Listed
9 launches
Staying on top of what your competitors are doing requires either a dedicated research team or the discipline to manually check dozens of web pages on a regular basis. Rival Radar eliminates both those requirements by automating competitive monitoring through AI-powered discovery and continuous page tracking. The platform targets businesses that need to know when competitors make meaningful changes to pricing, features, messaging, or positioning but lack the resources for a full competitive intelligence operation. Rather than asking users to manually input competitor URLs, Rival Radar accepts a simple description of what a company does, then uses AI to identify actual competitors based on real search results. Once identified, it continuously monitors pricing pages, homepages, feature lists, changelogs, careers pages, and integration pages. What sets Rival Radar apart is its focus on signal over noise. Most page-monitoring tools alert users to every change, including trivial updates like cookie banner rotations. Rival Radar instead extracts the semantic content that matters—pricing numbers, plan names, feature descriptions—and compares only those elements, ignoring markup changes. Severity is automatically ranked, with pricing changes flagged as major while typos remain silent. When something real does change, users receive a single consolidated alert via email, Slack, Discord, or custom webhooks with a one-sentence explanation of what changed and its business implication, not a raw HTML diff. The product reflects a clear understanding of how competitive research actually fails at most companies. Rather than trying to replace human analysts, it handles the tedious, repetitive work of checking pages and flagging genuine changes. The before-and-after diffing is available on demand for users who want deeper detail, but isn't forced into every notification. Pricing is explicitly free for the first three competitors with twice-daily checks, requiring no credit card. The site indicates paid tiers exist but doesn't detail pricing or competitor limits in the provided content. For small teams and solo founders, the free tier offers real utility. For companies watching more competitors, the upgrade path presumably exists but remains unspecified in available materials. Rival Radar addresses a genuine friction point in how businesses stay competitive. It's not a substitute for strategic analysis but a pragmatic tool for the routine monitoring that most companies neglect or do inefficiently.


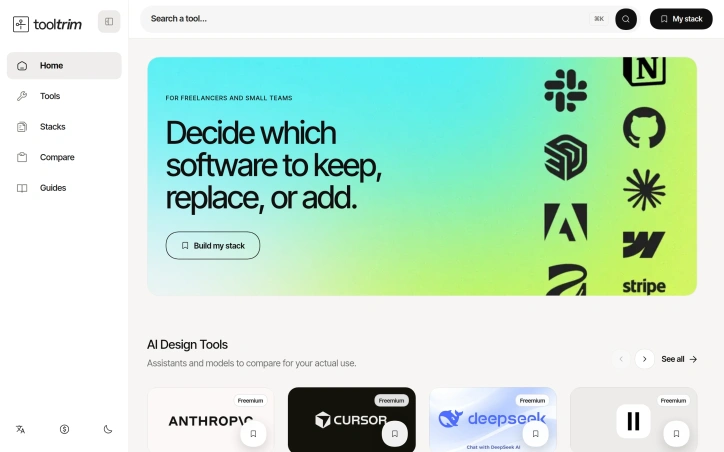
Choosing a tech stack can feel paralyzing. With hundreds of software options available, each claiming superiority, and budgets that don't stretch infinitely, freelancers and small teams often find themselves trapped between decision paralysis and the fear of overspending on tools they'll never fully use. ToolTrim tackles this exact problem by organizing the chaotic landscape of software into a searchable, categorized directory with editorial guidance. The product's core strength lies in its practical approach to stack building. Rather than overwhelming users with unfiltered tool lists, ToolTrim emphasizes workflow-based organization. The catalog branches into intuitive categories—Content Creation with 172 tools, No-Code & Web with 130 tools, Communication with 54 tools—each designed to help users quickly locate relevant options for their specific needs. The platform highlights free and freemium tools, acknowledging the budget constraints that define small-team workflows. What distinguishes ToolTrim from a simple tool directory is its editorial curation. Featured tool selections, a New Additions section tracking recent catalog entries, and a Works with integration view help users understand not just what tools exist, but how they fit into broader ecosystems. The platform goes further by offering pre-built curated stacks tailored to specific roles: freelance developer stacks, designer stacks, even interior designer stacks. This removes guesswork from the decision-making process and provides immediate, role-specific starting points rather than forcing users to navigate a sprawling catalog from scratch. The automation section indicates the platform recognizes that stack decisions aren't just about individual tools but about workflow efficiency. By showcasing tools that connect and streamline repetitive tasks, ToolTrim positions itself as concerned with the full picture of how software choices compound across a user's daily work. The navigation includes language localization and dark mode, suggesting attention to user experience details that matter for professionals working long hours across different environments. No pricing information is disclosed for ToolTrim itself, only for the third-party tools within the catalog. For freelancers and small teams drowning in tool options, ToolTrim offers a straightforward solution: a thoughtfully organized directory with enough curation to guide decisions without the paralysis of limitless choice.

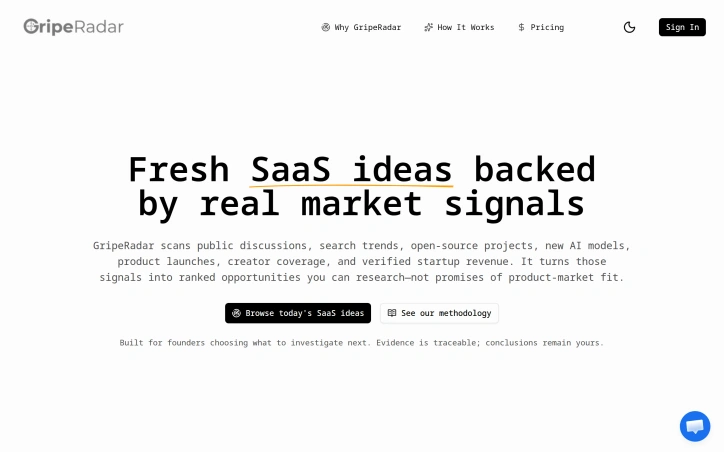
Opportunity research for founders typically follows one of two patterns: either they're overwhelmed by endless brainstorming, or they're drowning in polished lists that sound promising but reveal nothing about market validation. GripeRadar directly targets the decision paralysis that follows, offering founders a data-driven shortcut to the ideas most worth investigating. The product scans seven categories of market signals—public discussions, search trends, open-source projects, new AI models, product launches, creator coverage, and startup revenue data—then ranks opportunities by signal strength and corroboration. Rather than presenting a curated list of ideas backed by guesswork, GripeRadar surfaces ranked candidates with traceable sources and transparent confidence levels. What distinguishes GripeRadar from generic ideation tools is its commitment to separating signal from certainty. The interface offers both an Opportunity score and a Confidence rating, making clear that a high-ranked idea may still carry real uncertainty. This transparency reflects the founder's own frustration with SaaS idea lists that hide doubt behind opaque AI scoring. The company explicitly positions itself as a research starting point, not a predictor of product-market fit. The daily refresh cycle keeps the opportunity radar current, pulling from real-time market activity rather than stale snapshots. The bounded preview access lets prospective users quickly evaluate whether an opportunity is worth deeper investigation before committing to a subscription, a smart onboarding choice for a research product. The five visible examples showcase the breadth of signal detection—ranging from infrastructure gaps like deterministic testing tools, to emerging verticals such as AI for dental practice management, to security concerns around AI incident coordination. The specificity of these opportunities, tied to actual market signals rather than founder intuition, sets the product apart. One limitation: the website provides no detail on pricing or business model, making it unclear what access costs or subscription tiers exist. For a product built on the premise that quality research is worth time and attention, transparent pricing would strengthen the value proposition. For early-stage founders weighing what to build next, GripeRadar offers a structured alternative to unfounded brainstorming. It trades inspirational breadth for evidentiary depth—exactly the choice many founders need to make.

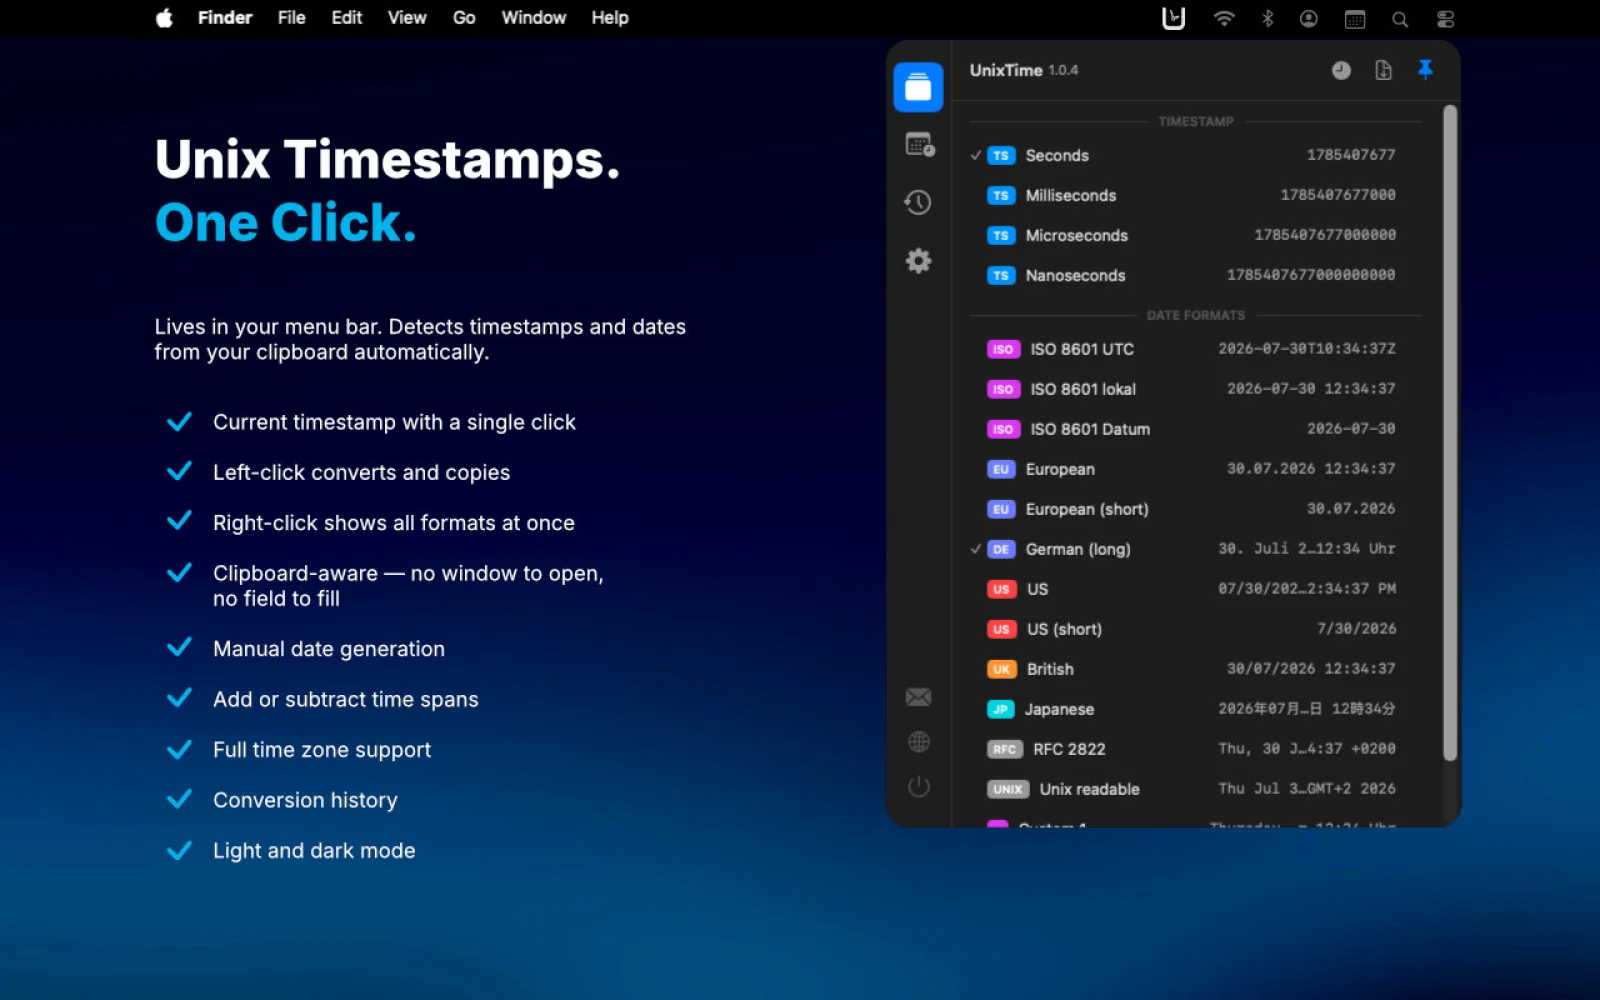
Developers working with Unix timestamps face a recurring friction: converting between epoch time and human-readable dates typically requires opening a browser, finding a converter, and pasting back and forth. UnixTime, a native macOS menu bar app, eliminates this workflow entirely by placing timestamp conversion directly where developers already spend their attention—in the menu bar. The core interaction is immediate. Hover over the menu bar icon to see what's on your clipboard, its conversion counterpart, and what a single click will copy, all before committing to the action. Click left to perform a conversion or copy the current timestamp if the clipboard is empty. Right-click to see all available output formats at once, customizable through drag-and-drop to show only what matters. The app operates completely offline, never transmitting data outside the local machine. What distinguishes UnixTime is its comprehensive format support. Beyond the standard Unix seconds and milliseconds, it handles microseconds, nanoseconds, and platform-specific formats used by .NET, Windows, Chrome, WebKit, Mozilla, Apple, and legacy Macintosh systems. It even converts astronomical Julian Day Numbers. Timestamps appear with their units labeled, eliminating ambiguity about scale. A built-in date and time calculator moves beyond simple conversions. Users can construct specific moments by entering dates, adjusting values by seconds through years, switching time zones, or generating random dates for testing purposes. Every conversion gets logged in a searchable history tied to the source application, so previously converted values can be retrieved and recopied without re-entering data. Customization is thorough. Users control which formats appear and in what order, set preferred defaults for timestamp and date output, and create unlimited custom date formats with unique names and patterns. The app respects macOS appearance settings, automatically following light and dark modes or locked to either. Localization spans 12 languages, and the business model is straightforward: a 2.99 euro one-time purchase with no subscription, advertisements, or data collection. The result is an app built directly for how developers actually work—minimizing context switching and reducing unnecessary steps in a task they perform hundreds of times.

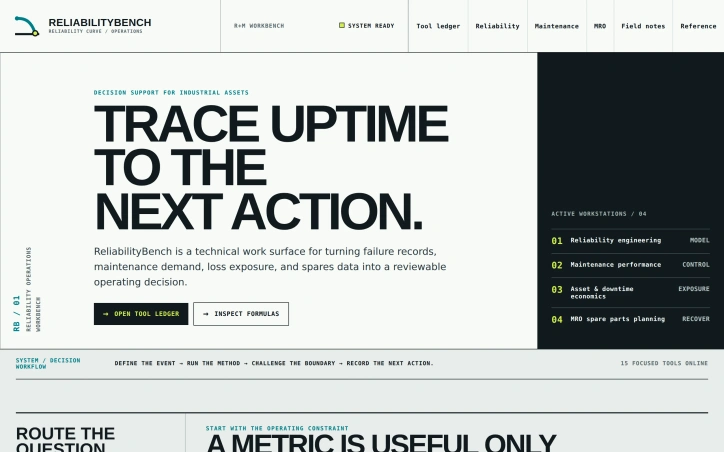
Industrial operations teams sit on vast repositories of failure data and maintenance records but struggle to convert them into concrete decisions. ReliabilityBench addresses this disconnect by creating a transparent calculation surface that links reliability metrics, maintenance performance, equipment economics, and spare parts planning into a single workbench. The platform targets reliability engineers, maintenance supervisors, production leaders, and asset management teams who need rapid calculations during active work. Rather than attempting to replace comprehensive CMMS systems or detailed engineering studies, ReliabilityBench positions itself as a decision-support layer that lives alongside existing tools. What distinguishes the product is its deliberate focus on decision-making rather than data collection. The interface organizes work around a clear problem-solving sequence: define the failure event, apply a specified calculation method, validate the result against operational reality, and route the output into concrete work assignments or planning. This workflow frames the calculator not as an isolated number-generator but as the middle step in a larger decision chain. The platform offers fifteen focused calculators distributed across four workstations. The Reliability Engineering station includes tools for normalizing failure history into operating intervals. Maintenance Performance handles availability, performance, and quality loss tracking. Asset & Downtime Economics exposes cost contribution and recovery expenses. MRO Spare Parts Planning connects lead-time demand with safety buffers. Specific tools include MTBF calculators, OEE tracking, downtime cost analysis, repair-versus-replace comparisons, and reorder point calculations. A striking design choice is the open tool ledger—each calculation displays its inputs, methodology, worked examples, interpretation guidance, and stated limitations directly adjacent to the result. This transparency invites teams to audit assumptions before treating a number as operational truth, surfacing where a calculation may diverge from actual site conditions. The platform records a complete operational chain through five stages: failure definition, response documentation, consequence quantification, recovery readiness, and review for the next action. This evidence trail preserves context across decisions, helping teams validate whether repeated comparisons remain consistent. ReliabilityBench addresses a genuine operational need—turning data into decisions—with a deliberately scoped tool that complements rather than displaces existing infrastructure. Its emphasis on formula transparency and decision context distinguishes it from pure data collection systems.

Helping homeowners quantify energy spending and environmental impact, EcoEnergyCalc offers a free suite of calculators designed to eliminate friction between users and sustainability decisions. The product targets homeowners and environmentally conscious individuals seeking concrete data on consumption patterns without signup walls or surprise fees. The breadth of the calculator library stands out immediately. Rather than a single-purpose tool, the platform bundles eighteen calculators spanning home energy costs, appliance consumption, solar returns, carbon accounting, and lifestyle impact. Users can model electric bill drivers, estimate LED bulb savings, calculate solar panel payback periods, or assess flight emissions from a unified interface. This variety appeals to people at different decision points, from those seeking quick cost-cutting wins to those evaluating capital investments like solar installation or electric vehicle purchases. The execution emphasizes frictionlessness. There is no account creation, no email verification, and critically, no hidden fees. Results appear instantly after entering location and usage data, which directly addresses a widespread frustration where competing energy tools bury actual calculations behind signup screens or gate analysis behind paywalls. The transparent free model removes the suspicion many users bring to digital tools in this category. The calculator scope reflects genuine homeowner priorities. Beyond standard energy cost tools, the platform includes fuel type comparisons, water usage tracking, rainwater harvesting analysis, and battery storage sizing. Carbon footprint calculators extend beyond home energy to cover diet, transport, and tree-planting offsets. This breadth signals the product recognizes that sustainability decisions span multiple domains and require different calculation frameworks rather than a monolithic one-size-fits-all approach. The platform's free-forever positioning stands in stark contrast to competitors that monetize through premium tiers or conversion funnels built into the calculation process itself. Users get results without the usual gatekeeping. What remains unclear is the depth of underlying data and methodology. Whether these calculators incorporate local utility rates, track equipment efficiency curves, or update carbon accounting as electrical grids decarbonize cannot be assessed from the interface description alone. A calculator's real utility depends entirely on data quality and update frequency. The gap between smooth user experience and analytical rigor will ultimately determine whether this becomes a genuinely trusted decision-support tool or merely a polished curiosity.

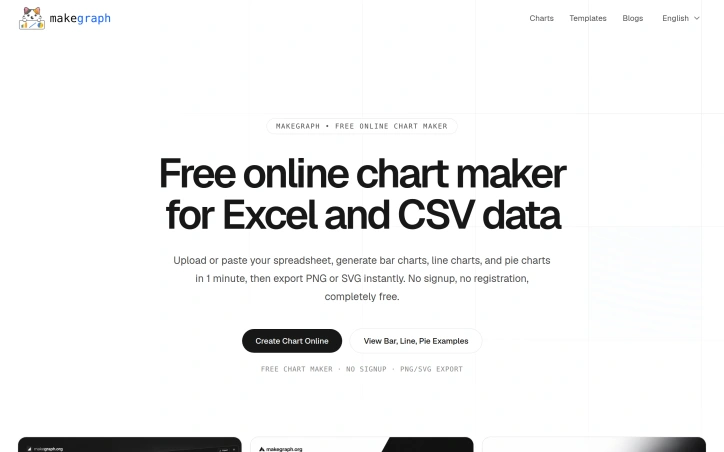
Data visualization is a crucial step in understanding and presenting complex information, but creating clear and compelling charts can be a tedious task, especially for those without extensive design or technical expertise. MakeGraph addresses this issue by providing a straightforward online chart maker that allows users to quickly transform their data into visually appealing charts. The tool is designed for individuals who need to generate charts for reports, presentations, and dashboards, and is particularly useful for those working with Excel or CSV data. What stands out about MakeGraph is its simplicity and versatility. The platform offers a range of chart types, including line charts, scatter charts, radar charts, and various bar chart configurations, such as stacked and waterfall charts. Users can upload their data or paste it directly into the tool, customize labels and colors, and preview their charts instantly. The ability to export charts as PNG or SVG files adds to the tool's convenience, making it easy to integrate the visualizations into various applications. The key features of MakeGraph include its ease of use, instant preview capabilities, and support for multiple chart types. The fact that it is completely free, with no signup or registration required, makes it an attractive option for users who need to create charts on the fly. The tool's flexibility in handling different data formats and its customization options further enhance its utility. Overall, MakeGraph is a valuable resource for anyone looking to simplify their data visualization process and create high-quality charts without fuss.

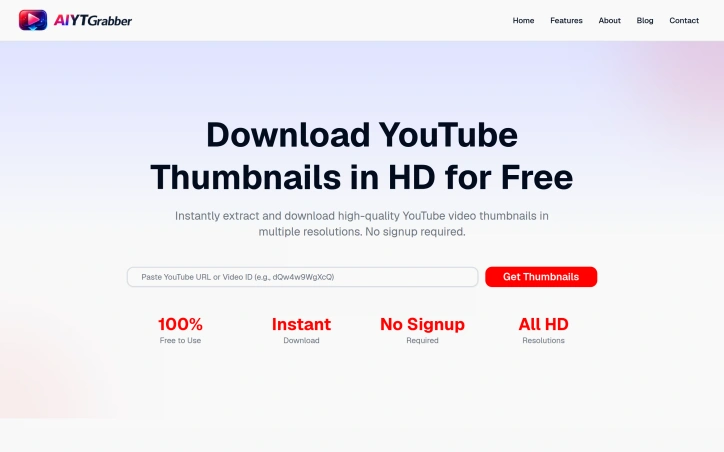
Creators and content enthusiasts often need to download thumbnails from YouTube videos for various purposes, but the process can be cumbersome due to the lack of a straightforward download option on the platform. The YouTube Thumbnail Downloader addresses this issue by providing a simple and efficient way to extract and download high-quality thumbnails in multiple resolutions. This tool is particularly useful for creators, researchers, and marketers who need to analyze or reuse these images for legitimate purposes. What stands out about this product is its emphasis on ease of use and speed. The tool allows users to download thumbnails instantly without requiring any signup or installation, making it a convenient solution for those who need to access these images quickly. The fact that it works seamlessly on all devices, including desktop, tablet, and mobile, further enhances its accessibility. The tool's capabilities are impressive, with features such as instant extraction, multiple resolution options ranging from 120x90 to 1280x720, and unlimited downloads. The process is straightforward, involving just three steps: pasting the YouTube video URL or ID, clicking to extract thumbnails, and downloading the desired resolution. The tool also automatically detects and extracts thumbnails from various URL formats, adding to its convenience. Notably, the tool is completely free to use, with no limitations on the number of downloads. The absence of any pricing details or business model information suggests that the tool is supported by a different revenue stream, allowing users to access its features without incurring any costs. Overall, the YouTube Thumbnail Downloader is a valuable resource for anyone needing to access YouTube thumbnails, offering a fast, easy, and cost-effective solution.
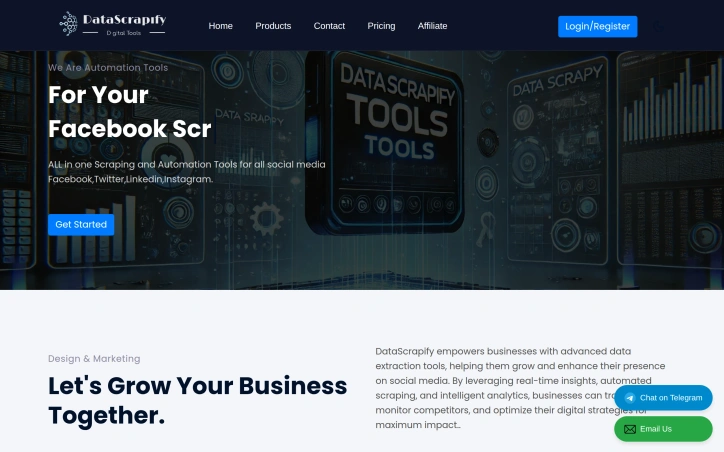
Automating social media outreach and lead generation across multiple platforms is a time-consuming challenge for growing businesses. DataScrapify addresses this directly by bundling data extraction, email scraping, and social media automation into a single cloud-based platform. The product targets businesses and digital marketers who need to collect contact information and execute bulk messaging campaigns across Facebook, LinkedIn, Instagram, Twitter, and YouTube without managing separate tools. The platform's architecture centers on lead generation and automation. Its toolkit includes email extraction from websites and social directories, bulk message sending across social channels, scraper tools for follower and group member data, and phone number collection capabilities. These features work across major social platforms, making it possible for users to consolidate operations rather than juggling multiple specialized services. A notable differentiator is the cloud-based infrastructure, which eliminates installation and platform dependencies. Users access all tools through a web interface, removing friction for businesses that want quick onboarding. The pricing model is straightforward: a monthly subscription at $100 includes access to all 21 automation tools with unlimited campaigns and unlimited results, positioning it as cost-effective for SMBs and agencies seeking an alternative to point solutions. The platform also emphasizes accessibility through its support structure, claiming 24-hour resolution for customer issues. However, the product documentation is sparse and the website copy suggests room for improvement in presentation and clarity. The tool appears functional for its core use cases, but prospective customers should verify whether the platform's scraping capabilities align with their specific social media channels and compliance requirements. The target audience seems to be growth teams, lead generation agencies, and marketing departments seeking affordability without complexity. DataScrapify makes a clear value proposition around consolidation and cost-effectiveness. Its strength ultimately depends on the reliability and accuracy of the underlying scraping technology—details not evident from public positioning alone.